




Summary
Market thesis: NBIS shares in an uptrend, volatility expanding
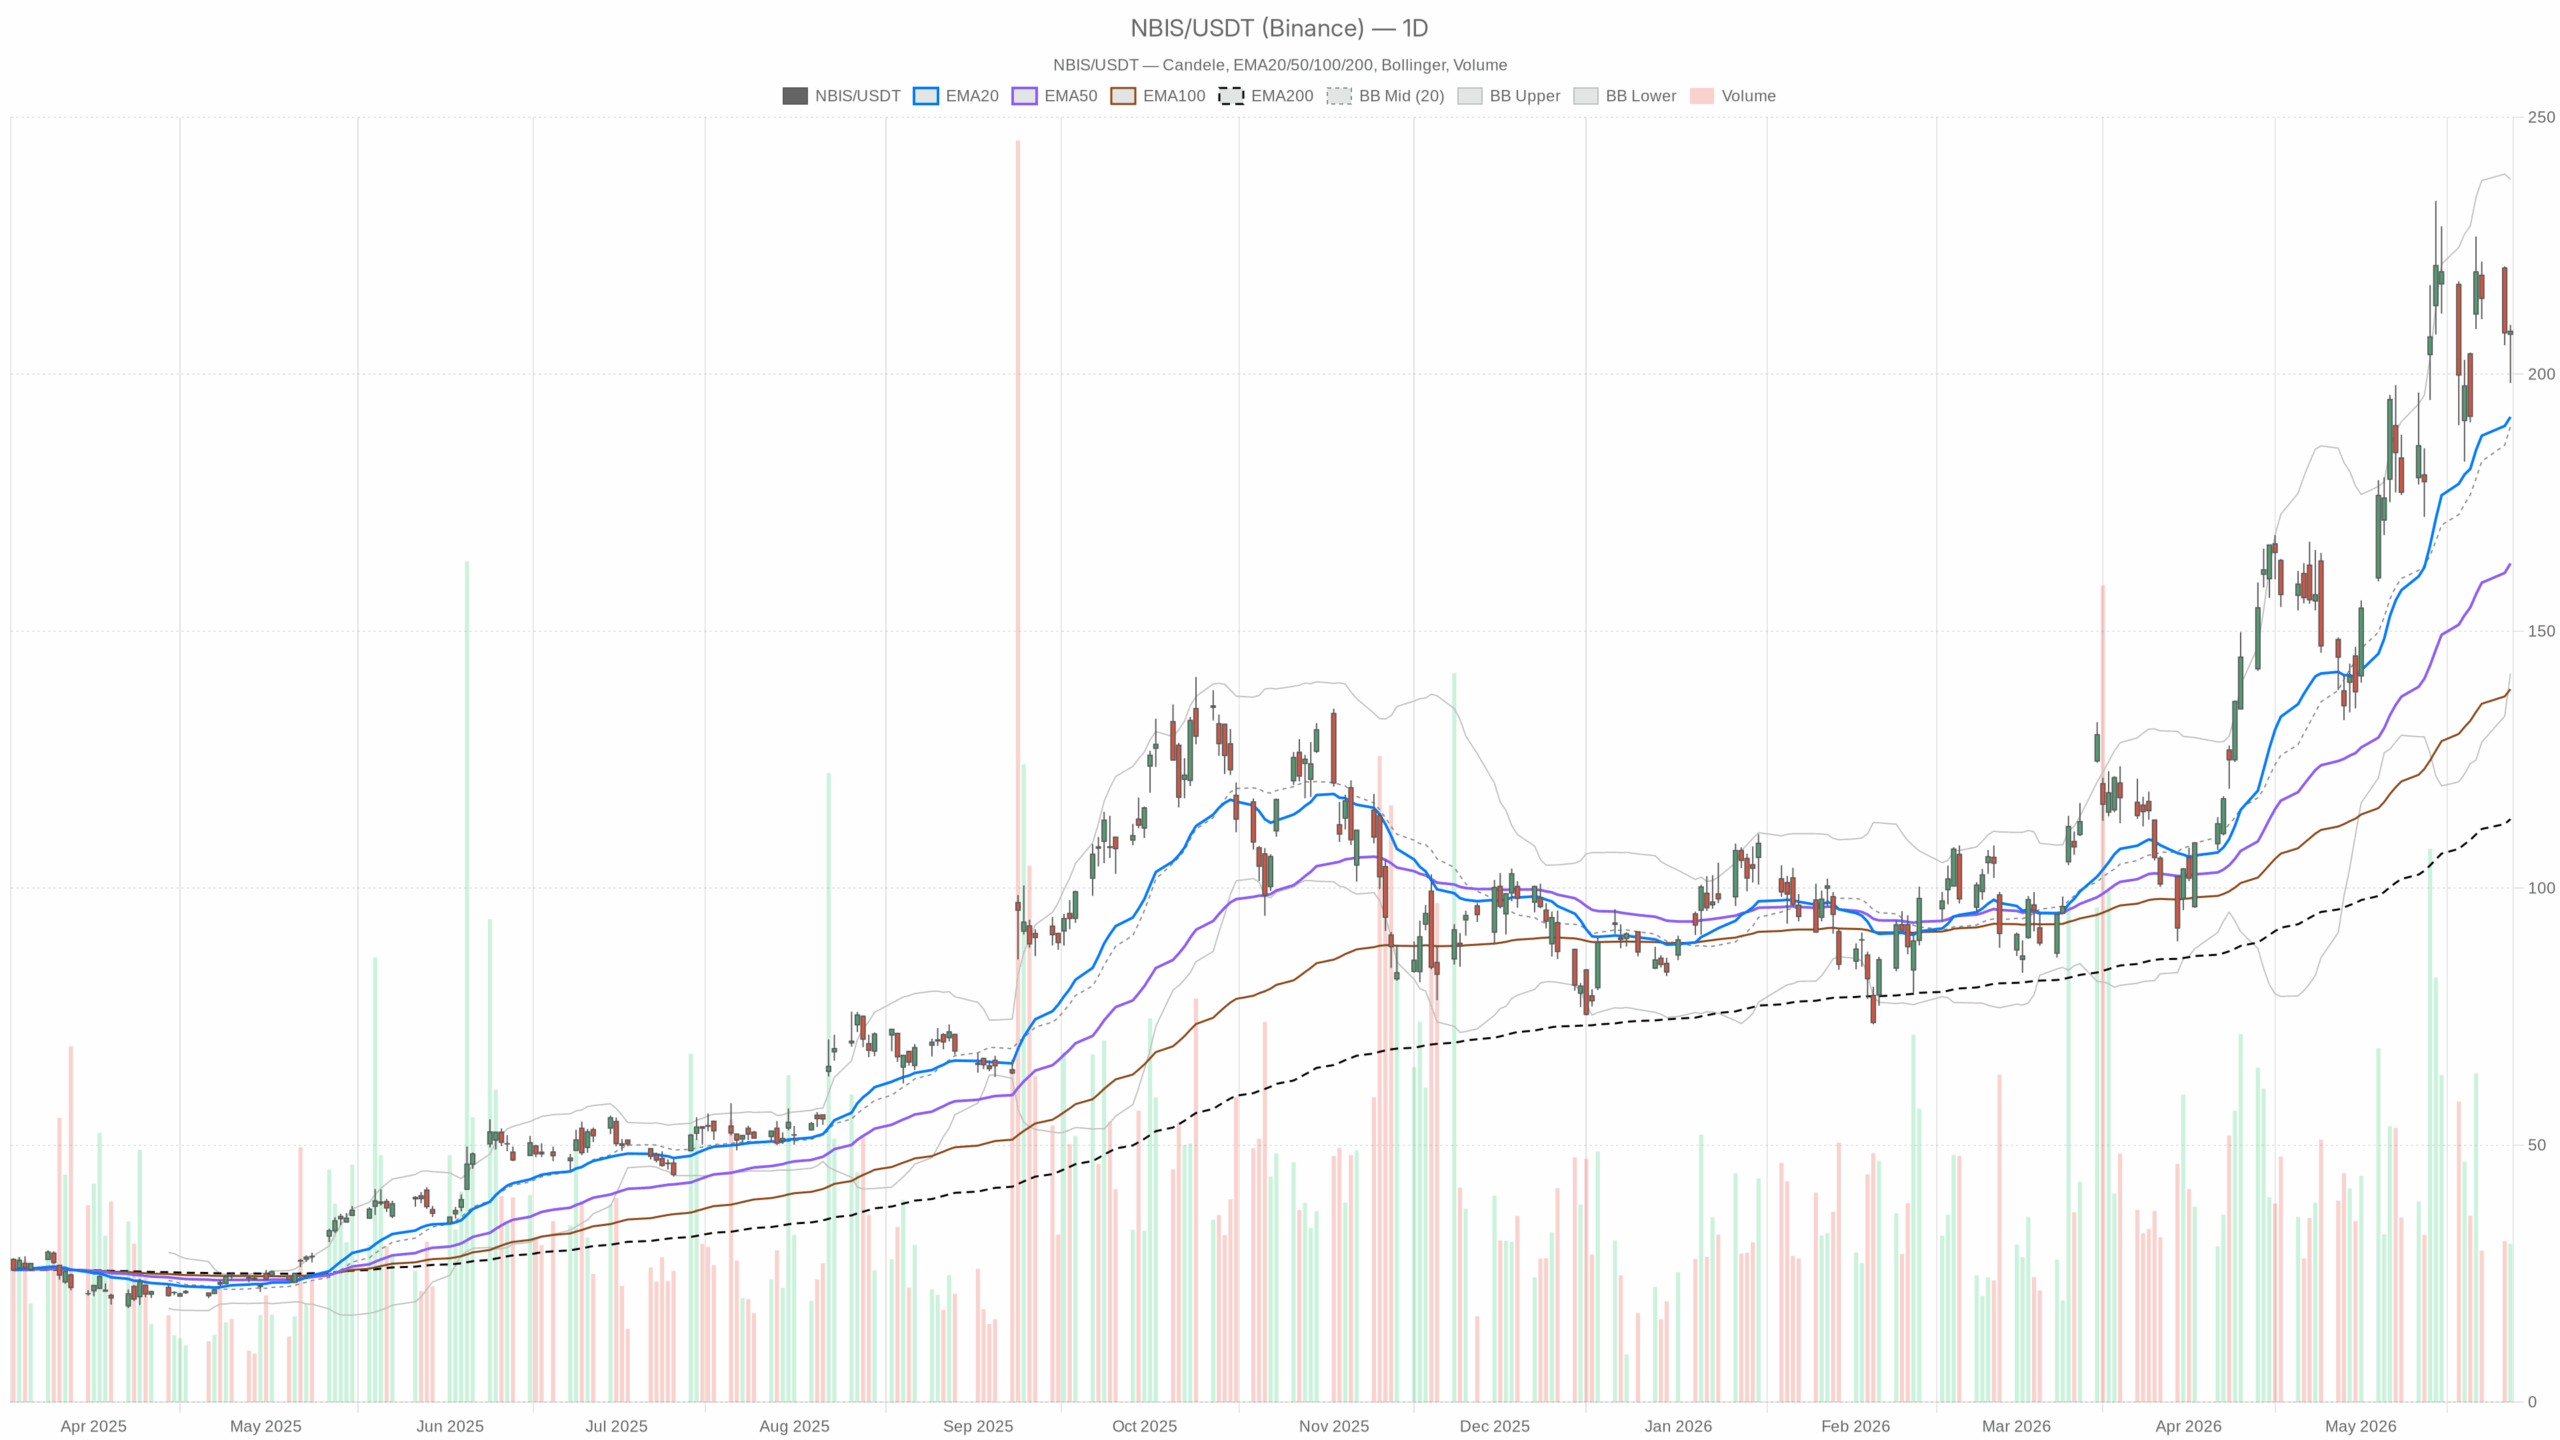
NBIS shares close at 208.37 on 27/05, above key levels and with increasing volatility (ATR14 at 20.26). This is an important stage: the price remains above the daily Pivot Point at 205.43 level and is approaching the 209.60–212.54 resistance band. The dominant force is the underlying uptrend; meanwhile, the slight cooling in the MACD on D1 suggests consolidation near recent highs.
Daily analysis: NBIS shares above averages, momentum positive
The outlook on D1 remains constructive. The 208.37 close is well above EMA20 at 191.71, EMA50 at 163.19 and EMA200 at 113.44, with the 20>50>200 sequence intact. The structure shows buyers in control; at this stage, possible pullbacks towards EMA20 remain physiological.
The RSI at 60.46 supports positive momentum away from extremes. The MACD (line 16.89, signal 17.21, histogram -0.32) remains above zero but below the signal: within the dominant uptrend, the impulse is in a temporary pause.
Bollinger Bands show a median at 189.86, an upper band at 237.94 and a lower band at 141.78. The price remains above the median; this is consistent with a bias towards expansion into the upper area. ATR14 at 20.26 confirms the width of the daily range and an expanding volatility phase.
Levels: session range 198.31–209.60, volumes 11,085,968. The price is above PP at 205.43 and below R1 at 212.54; S1 is at 201.25. As long as it stays above 205–206, the flow remains oriented towards tests of 209.60 and 212.54; a move below 201.25 increases the probability of a correction towards 198.31 and, in extension, towards the 189.86 median.
1-hour analysis: consolidation in the 207–209 band, mixed momentum
On H1, the price at 208.44 is oscillating in a neutral regime. EMA20 at 208.65 is slightly above the price, while EMA50 at 207.05 offers the first support. EMA200 at 182.18 remains distant and does not affect the short term. The RSI at 49.55 indicates balance, while the MACD (line -0.84, signal -0.33, histogram -0.51) is still negative.
On H1 Bollinger Bands, the median is at 210.16, while the price is below the midline: momentum needs to recover to attack the 209–210 area again. ATR14 at 4.27 shows that intraday swings remain wide. Intraday pivots: PP 208.28, R1 209.34, S1 207.38. Holding 207.38–208.28 keeps the constructive tone; a break above 209.34 reopens the space towards the 209.60 highs.
15-minute analysis: short-term positive pressure and 209.18–209.34 cluster
The 15-minute outlook is slightly bullish. The price at 208.44 is above EMA20 at 206.95, EMA50 at 207.89 and EMA200 at 207.50. The RSI at 55.11 and a positive MACD (0.40 versus -0.03, histogram 0.43) support a short-term positive bias. The Bollinger median is at 206.29, while ATR14 at 1.85 defines tight but manageable swings.
Trading area: PP 208.39 as the pivot, R1 209.18 and S1 207.65. The 209.18–209.34 band (intersection of M15 R1 and H1 R1) represents the first rejection/continuation node. Controlled pullbacks towards 207.65–208.00 keep buying pressure alive as long as they are defended.
Bullish scenario for NBIS shares
To extend the move, the stock needs to: 1) hold above 205–206 (D1 PP 205.43) and 207.38 on H1; 2) close H1 above 209.34 and break 209.60; 3) post a daily close above R1 at 212.54. In parallel, a rise of the daily RSI towards the 65–70 band and a renewed positive expansion of the D1 MACD histogram would improve the quality of the trend. On H1, stability above the 210.16 Bollinger median improves momentum; expanding volatility supports orderly breakouts.
Bearish scenario: levels that could invalidate the outlook
The bullish scenario weakens if there is rejection below 209.18–209.34 and a loss of 207.65, followed by a break of 207.38 (H1 S1). A close below 205–206 (PP 205.43) shifts the center of gravity to D1 S1 at 201.25. A daily close below 201.25 opens space towards 198.31; in extension, a return to the D1 Bollinger median at 189.86 cannot be ruled out. Accompanying signals would be a D1 RSI sliding below 55 and an H1 MACD remaining in negative territory.
Context reading and levels monitored on NBIS
The market still indicates leadership of the uptrend in NBIS shares, together with a tactical intraday pause. Uncertainty is concentrated in the 209–212.54 band: the next impulse or a new breather will take shape there. Traders are particularly watching 205–206 as a threshold on the daily, 207.38–208.28 on H1 to confirm consolidation, and 209.18–209.34 to open a test of 212.54. As long as the price remains above 205–206, pressure is upward; below 201.25, the picture changes markedly.
